US private debt at maximum levels: recorded a 1.4% growth.
US Private Debt Evolution
In February 2020 the Center for Microeconomic Data of the Federal Reserve Bank of New York published the quarterly report on US private debt. The figures, updated to the last quarter of 2019, show an overall increase in debt. Mortgages remain the largest slice of debt. The level of mortgage debt at the end of December was $9.56 trillion, up $120 billion (Figure 1). The total non-housing debt grew by $79 billion, with generalized increases. This marks the 22nd consecutive quarter with an increase.
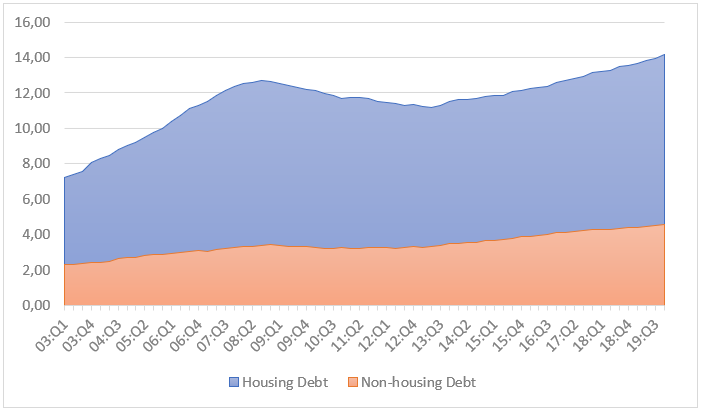
Figure 1: US Total household debt (Source: FRBNY Consumer Credit Panel/Equifax)
More specifically, auto loans increased by around $16 billion, credit card debts by $46 billion and student loans by $10 billion, continuing to be a sore point for American families (Figure 2).
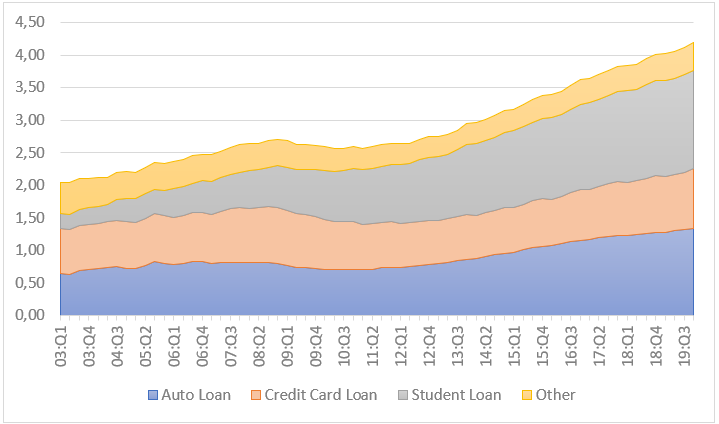
Figure 2: US non-housing debt (Source: FRBNY Consumer Credit Panel/Equifax)
US Delinquency Rates Evolution
Overall delinquency was mostly the same in the fourth quarter of 2019. As of December 31, 4.7% of total debt was insolvent, down 0.1% compared to the third quarter because of a decrease in early delinquency buckets. However, the 90+ days delinquency rate (Figure 3) grew slightly for both housing debt and non-housing debt, recording a total increase of about 0.2%. Of the $669 billion of insolvent debt, approximately $444 billion was seriously insolvent (at least 90 days late).
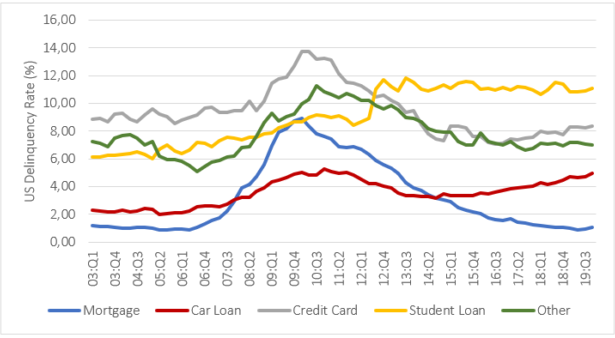
Figure 3: US delinquency rate (% balance of 90+ days delinquent) (Source: FRBNY Consumer Credit Panel/Equifax)
To Conclude...
Overall, in the fourth quarter of 2019 US private debt rose by around $193 billion (1.4%) to $14.15 trillion and hit a new record high. This is the 22nd consecutive quarter with a US household debt increase. Total debt is now $1.5 trillion higher than the previous peak of $12.68 trillion in 2008.