US household debt exceeds
the maximum levels reached in 2008
US Private Debt Growth
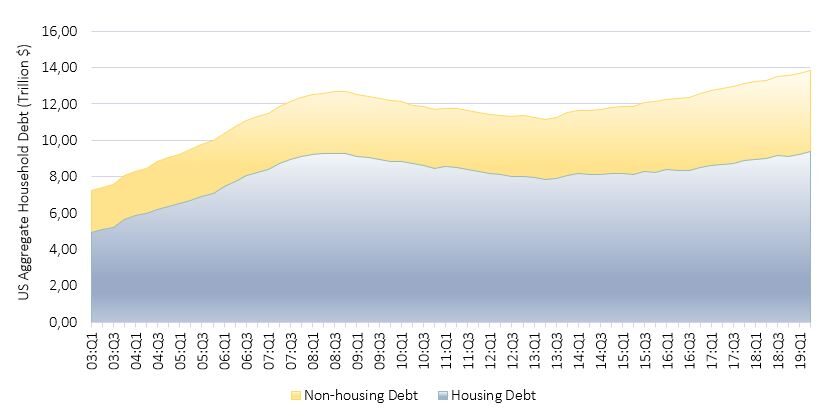
How is the US economy going ten years after the subprime crisis that has heavily affected the entire world? This question is legitimate given the data are not entirely positive. The reference is specifically to the trend of private debts, which is constantly increasing in recent years. Generally, when we talk about debt, we refer to the public one, underestimating the relevance of the private one and the fact that it was the latter that fueled the bubble that burst in the last decade. From the latest estimates, US aggregate household debt balances increased by 1.4%, standing now at $13.86 trillion. In the last five years, US debt has steadily increased and has now reached a new maximum value compared to the previous one recorded in 2008. Indeed, today the value of the aggregate debt is $1.2 trillion higher. Figure 1 graphically shows the trend of the US aggregate household debt balances in the last fifteen years. It has two components. The first one is the housing debt, which represents the largest part of the US total debt. Since 2013 it has steadily increased reaching a value of $9.4
trillion and exceeding the maximum of $9.3 trillion recorded in 2008. The second component is the non-housing debt. In comparison to housing debt, it has less weight on the total. In fact, it represents around 30%. Over the past few years, it has also grown gradually, even more than housing debt, reaching today a new high of $4.1 trillion.
More specifically, non-housing debt mainly includes student, car and credit card loans. Figure 2 shows its aggregate level highlighting the trends of the different sectors. The debt has increased since 2012 for all sectors, especially for student and car ones.
This trend in US private debt is consistent with the phenomenon of consumerism that is often associated with the United States. Despite low wages and limited financial resources, Americans continue to consume, borrowing for almost everything and becoming increasingly indebted.
Non-housing debt on the rise: the phenomenon of consumerism shows no sign of stopping
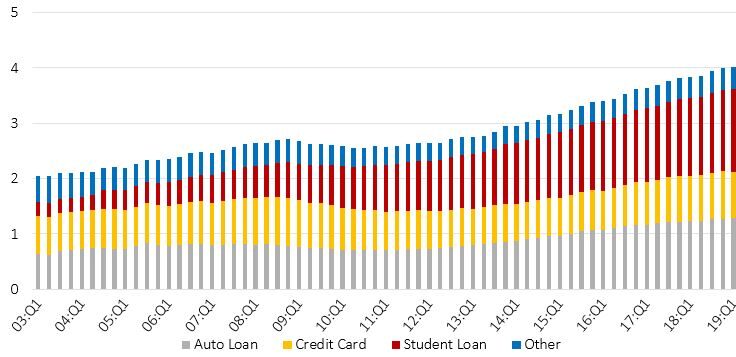
Figure 2: US non-housing debt components (Source: New York Fed Consumer Credit Panel/Equifax)
The US Delinquency Rate
Figure 3 graphically shows the aggregate insolvency rate, by severity. During and after the 2008 crisis, the default rate, particularly for mortgages, reached extremely high levels and an unprecedented number of properties entered foreclosure. This created a surge in severely derogatory balances that took years to shrink, even if delinquencies other than severe derogatories were declining relatively quickly.
Figure 3: US total delinquency rate by severity (Source: New York Fed Consumer Credit Panel/Equifax)
Severe derogatories represent around 50% of total delinquencies
Despite the gradual decrease in the overall insolvency rate, it is important to consider that, in the last period, severe derogatories haven't dropped so much thus assuming an ever-greater weight, coming to represent nearly half of all delinquencies.
In addition, if we observe how the insolvency rate for individual sectors has evolved over the years (Figure 4), it is interesting to note that after 2008, in the case of mortgages, it gradually decreased, with minimal levels to date, while in other cases it is constantly growing, thus highlighting a greater inability of consumers to repay non-housing debt. This situation may represent a sign that after 2008 the attention by lenders and institutions in the granting of mortgage loans, which caused the outbreak of the crisis, has increased. The same selectivity has not been put into practice for the other types of loans, whose probability of not being repaid is decidedly higher.
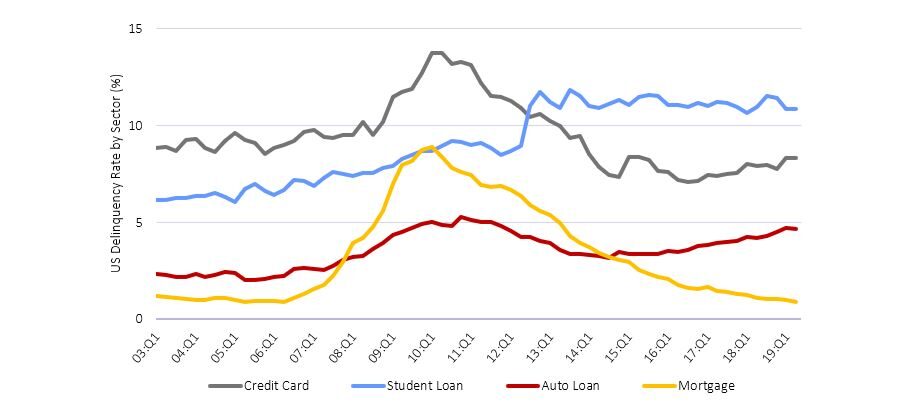
Figure 4: Us delinquency rate by sector (Source: New York Fed Consumer Credit Panel/Equifax)
To Conclude...
From the observation of the data, today in the United States, the total level of private debt is extremely high, even higher than in 2008, driven also by the monetary policies of maintaining low interest rates, which encourage its growth. Non-housing debt has grown. This represents a sign of an increase in indebtedness even on less durable goods (cars, mobile phones, etc.), that cannot be considered investments for the future and whose value over time tends to decrease, thus marking a loss in the event of resale. Should we be worried about this situation? Certainly, compared to 2008 there are some mitigating factors, such as the GDP, which is constantly increasing and a sign of a better economy than it was during the financial crisis. In addition, debt
defaults are docile, recording minimal levels. However, it is also true that, as we have seen from Figure 3, today the severe derogatories are high and represent about half of the total insolvency. This therefore indicates a situation in which, despite the total levels being like those prior to the 2008 crisis, investors are more overwhelmed by growing obligations. In light of the above, we therefore consider the latter a factor to be kept under control, as it is significantly worse than the pre-crisis 2008 levels, and that, together with a much higher general level of debt, could have a relevant weight in case in which some cracks began to appear. In addition to this, we think that in the near future more attention should be paid, not so much on housing debt, but on non-housing debts, whose insolvency levels are constantly growing. The greatest difficulties in the payment of personal debts, which in the event of lack of resources would be the first not to be paid, could represent an early warning signal of problems that over time could also extend to the payment of housing debt. It is from the trend of these debts that there could therefore be signs of potential future criticalities.