2019 average volatility, the lowest in the past ten years. In January 2020 VSTOXX at 10.6, absolute historical minimum.
Volatility in 2019
2019 has been a year characterized by low volatility. In fact, it has been the year in which the implied volatility index VSTOXX recorded the most contained values (Figure 1). There have been some increases in volatility, generally related to the trade war, concerns about interest rates and geopolitical tensions. However, 2019 average volatility has been the lowest of the past ten years. This trend is continuing also in the early days of 2020. On January 17, the VSTOXX index registered a value of 10.6, the absolute minimum reached in history.
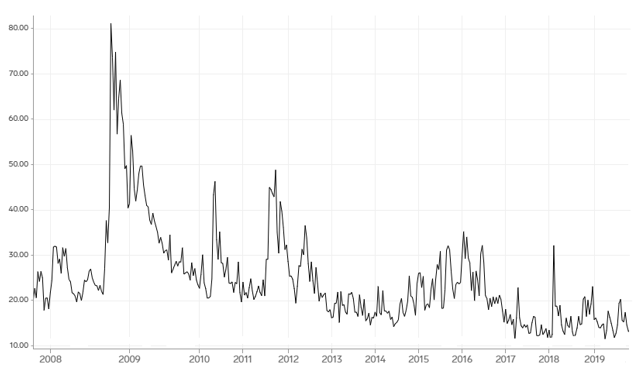
Figure 1: 2008-2019 VSTOXX chart.
The Concept Of Implied Volatility
Implied volatility (IV) is a metric that expresses the market's expectations regarding the probability of price changes for a given security. However, it does not provide for the direction of movement. A high IV indicates that the market thinks the stock has the potential for high price swings in both directions. It differs from historical volatility. The latter, also known as realized volatility or statistical volatility, is a measure of how the market moved. It is therefore not an expected value, but an indicator of what happened in the past. There exist different volatility instruments, that track the value of implied volatility of other derivative securities. For instance, the CBOE Volatility Index (VIX) is calculated from a weighted average of implied volatilities of various options on the S&P 500 Index. In the European context, the stock market volatility index is the VSTOXX. It represents the implied 30-day volatility of the EURO STOXX 50, and its value is defined through the options that use the EURO STOXX 50 as the underlying. More specifically, the calculation method is based on the interpolation of sub-indices, which are derived by appropriately combining options with different strikes and maturities. The final calculation of the VSTOXX consists of a time weighted average of these sub-indices.
The equity index implied volatility therefore derives from the option prices. The options themselves have an IV. Given the prices, the IV is derived iteratively through the application of the Black-Scholes formula. Like the whole market, implied volatility is subject to unpredictable changes. Its value is directly influenced by the supply and demand of the option. Since derived from the price, it is an expression of the negotiations that take place on the market, in turn guided by the evaluations and expectations of the investors. Precisely for this reason it must be understood as implied. The higher the implied volatility, the higher the option price.
Factors Moving Implied Volatility
Implied volatility moves in relation to different elements:
1) The trend of the stock. The greater the price change in the underlying asset, the greater the implied volatility. It remains low or unchanged when the price remains constant or moves slightly. Furthermore, volatility movements must be considered in relation to time. If the underlying security increases in price but the increase occurs gradually over time, volatility will not undergo significant changes. If, on the other hand, the price movement occurs suddenly or in a short period of time, then there will be a spike in volatility. Figure 2 shows what has been described so far. The strong price movements, especially on the downside, of the S&P500 in a short period of time, correspond to the peaks in the VIX index.
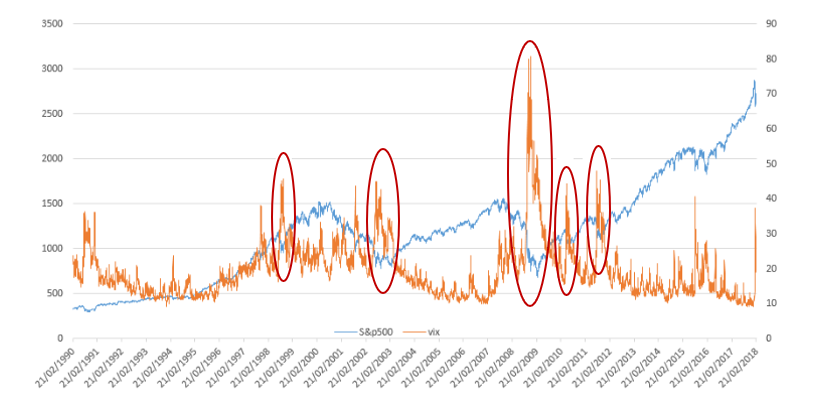
Figure 2: S&P 500 and VIX relationship over the years.
2) News and events. It is important to clarify that IV does not move only by following the logic described above. It considers any news or upcoming events that could shift the price (e.g. earning reports). Movements in implied volatility may also be due to important news on a larger company in the same industry that the smaller company's stock price follows, or to expectations about the industry in general. The "doubt" component towards the future, explains how, despite a sharp movement of the stock in the face of a certain news item, the IV does not always splash upwards. This phenomenon is described as "volatility crush". Volatility, high due to an imminent event, tends to decrease after that event, since there is no more uncertainty. Figure 3 highlights this concept. We note that in the days following the earnings report by Bed Bath & Beyond Inc. in 2015, the stock implied volatility registered very significant downward peaks. Furthermore, the performance of the stock in 2015 (Figure 4) allows us to observe that volatility peaks do not always correspond to price drops. For example, on April 1, 2015, the day following the earnings report, the price recorded a significant drop. Implied volatility did the same, influenced by the fact that the element of uncertainty had passed. This shows what has been said, namely that the movement of IV is not driven exclusively by market trends.
What justifies such low implied volatility? A strong risk appetite for investors. How aware they are is unknown.
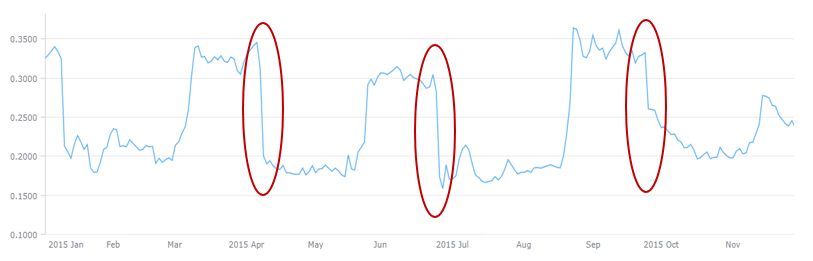
Figure 3: 2015 Bed Bath & Beyond Inc. Implied Volatility (30-Day).
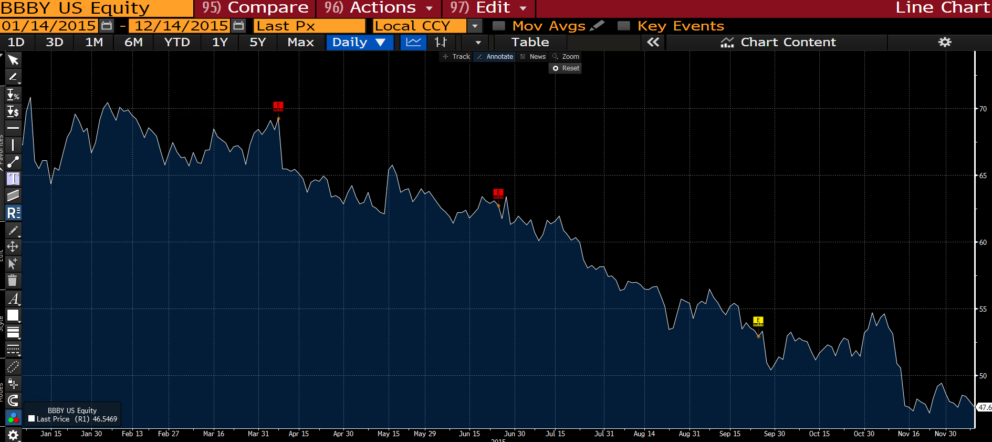
Figure 4: Bed Bath & Beyond Inc. price in 2015 (Source: Bloomberg).
To Conclude...
The implied volatility is therefore an expression of the uncertainty and market expectations regarding the future. The current situation runs counter to this concept. It is indeed interesting to note how in a year like 2019, characterized by many events and great uncertainties (US-China trade war, Brexit, geopolitical tensions, interest rates), volatility has registered very low levels, not showing a particular concern of investors for the future unknown. The only reason that can explain such low implied volatility is the extreme risk appetite of investors, which is higher than ever.